3D molecule figures
Give omgkit-depict a set of 3D coordinates and it draws the picture chemists
expect — space-filling, ball-and-stick, stick or wireframe, in CPK colours.
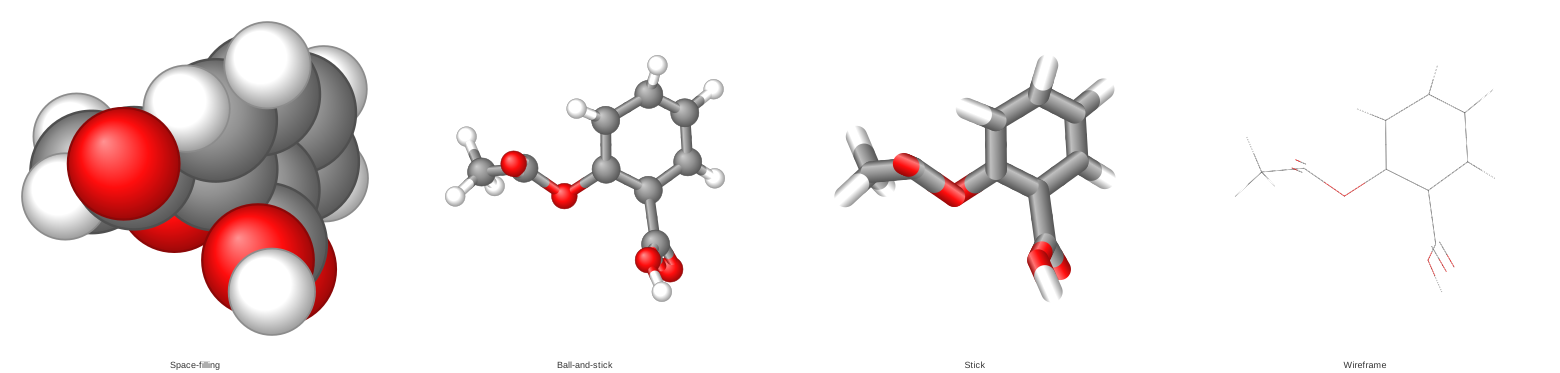
Aspirin, one conformer, four styles. Same coordinates, same viewpoint —
only the drawing changes. Every figure on this page is drawn by omgkit itself,
by docs/figures/make_figures.py.
>>> import omgkit
>>> conf = omgkit.parse_smiles("CC(=O)Oc1ccccc1C(=O)O").conformer()
>>> svg = conf.to_svg("ball-and-stick")
>>> svg.startswith("<svg")
True
The coordinates come from Mol.conformer() — distance
geometry with no random numbers, so the same molecule always gives the same
picture.
What a 3D figure shows that a structure diagram cannot
A structure diagram says which atom is bonded to which, and marks configuration with wedges. It says nothing about shape: every six-membered ring is a flat hexagon.
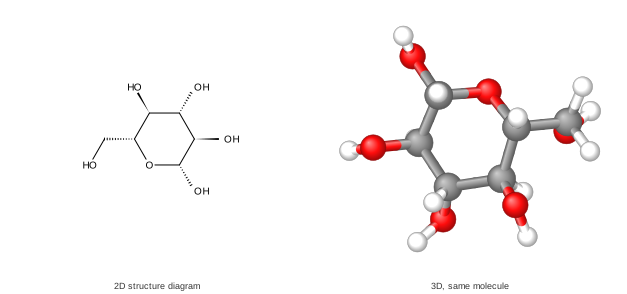
The same glucose. On the left, the ring is a hexagon and the substituents are wedges; on the right it is a real chair, and you can see which hydroxyls are axial and which are equatorial.
The two are complementary, not competing: for reading a reaction scheme you want the diagram — see Drawing structures.
The four styles
The names and the radii are not ours. They are Jmol's own standard rendering styles, transcribed:
style |
Jmol writes it | Ball radius | Stick radius | What it shows |
|---|---|---|---|---|
"space-filling" |
spacefill 100% |
100% of the van der Waals radius | — | how much room the molecule takes |
"ball-and-stick" (default) |
wireframe 0.15; spacefill 23% |
23% vdW | 0.15 Å | bond lengths, angles, configuration |
"stick" |
wireframe 0.3; spacefill off |
same as the stick | 0.30 Å | the skeleton, without clutter |
"wireframe" |
wireframe 0.01; spacefill 0 |
— | 0.01 Å | large systems, quick looks |
The van der Waals radii come from the element table omgkit already carries (Bondi's values, via BODR) — there is no second copy.
Each style carries its own scale — fix it before comparing them
Style3D::scale_pt_per_a is 24 pt/Å for space-filling and 36 for the other
three, so that each style comes out a sensible size on its own. Put
them side by side at their own scales and the space-filling panel looks
like a smaller molecule, which it is not. The figure at the top of this
page is drawn with all four forced to 36 pt/Å. The library will not do that
for you.
A style name it does not know is an error, never a silent fallback to the default:
>>> conf.to_svg("ball-n-stick")
Traceback (most recent call last):
    ...
ValueError: 不认识的三维样式 "ball-n-stick";认识的是:space-filling、ball-and-stick、stick、wireframe
Colours
CPK, in Jmol's variant.
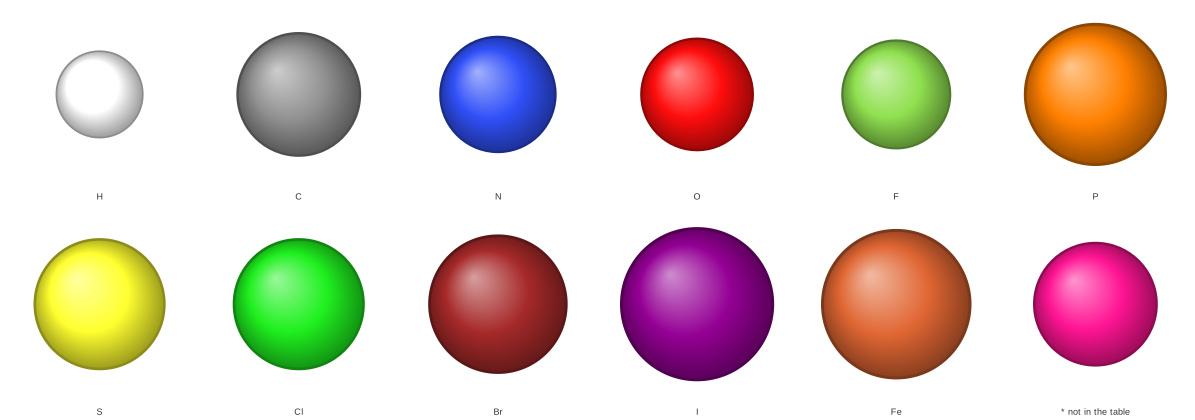
One atom per sphere, in the space-filling style — so the sizes are real
too: these are the van der Waals radii at true relative scale. The last
sphere is the SMILES wildcard *; its colour means "not in the table" and its
size is a stand-in, not a measurement.
Elements past meitnerium get the same deep pink. That is a marker, not a claim about the element, and it is meant to be jarring.
Each half of a bond takes the colour of the atom it touches, the way Jmol, PyMOL, VMD and 3Dmol.js all draw it:
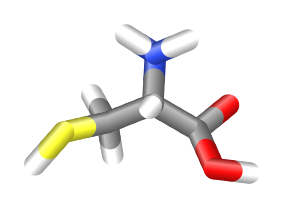
Cysteine, stick style. Every bond changes colour at its midpoint: C–S grey to yellow, C–N grey to blue, C–O grey to red. That is what makes a heteroatom findable in a picture with no labels.
The colour table is a drawing convention, not a physical property
It lives in omgkit_depict::palette, not in the element table. The same
carbon is #909090 in Jmol and #c8c8c8 in RasMol, while its van der Waals
radius is 1.7 Å in both. Putting the two in one table invites the next
reader to think a colour has a correct value.
The viewpoint
The molecule is turned so that its principal axes line up with the screen:
the direction it is most spread out along goes horizontal, the direction it is
least spread out along points at you. This is what PyMOL's orient and RDKit's
ComputeCanonicalTransform do, and the gate compares our rotation against both
of them, axis by axis.
Two things about it are worth knowing.
The rotation is never a mirror. Its determinant is always +1. In a 2D
structure diagram mirroring is harmless — configuration is carried by wedges,
which are assigned after the layout is flipped. In a 3D figure the
configuration is the coordinates: mirror them and every stereocentre in the
picture is inverted, with nothing on the page to show it. This is checked over
the whole corpus.
Sometimes the viewpoint carries no information. When symmetry forces two of the three principal moments to be equal — methane, carbon tetrachloride, ammonia, any linear molecule — the two axes involved can be spun freely in their plane. The picture is not wrong, but its orientation means nothing, so do not read a pose off it:
>>> omgkit.parse_smiles("C").conformer().depiction_3d_report()["degenerate"]
True
>>> conf.depiction_3d_report()["degenerate"]
False
Benzene and adamantane, which look symmetric enough to qualify, do not: their generated conformers are a few percent away from ideal, and that is enough to separate the axes. The measured gaps are in the source, next to the threshold they set.
The viewpoint depends only on the coordinates, so the four panels at the top of this page really are one view — a test pins that, and it is what lets them be read as a comparison.
What is behind what
SVG has no depth buffer, so the figure is drawn back to front — the painter's algorithm. Two consequences show up in the output.
Bonds are cut into slices. A stick that runs towards you spans a range of depths, and sorting a whole stick by one number puts it entirely in front of, or entirely behind, a sphere it actually passes through. Each half-bond is therefore sliced until no piece spans more than 0.25 Å of depth.
The part of a bond that is inside its own atom's sphere is not drawn at all. Without that trim, a bond leaning towards the viewer paints a crescent across the face of its own atom — the figure looks slightly dirty and nothing reports an error.
Where each atom landed
depiction_3d_report() gives you the canvas position of every atom, in the
same coordinate system as the SVG, so you can put your own labels or arrows on
top. Reading positions back out of the SVG would be guesswork: circles carry no
atom numbers.
>>> rep = omgkit.parse_smiles("CCO").conformer().depiction_3d_report()
>>> sorted(rep["atoms"][0])
['depth', 'radius', 'x', 'y']
>>> rep["style"], len(rep["atoms"])
('ball-and-stick', 9)
x, y and radius are in points, on the canvas. depth is in ångströms and
counts towards the viewer — the two units differ on purpose, because canvas
position scales with the figure and depth is a property of the molecule.
What it does not draw
- No atom labels. 3D figures identify atoms by colour; a label would need a place to go that the geometry does not provide.
- No perspective. The projection is orthographic, which is the convention for figures in the literature — parallel bonds stay parallel and equal bond lengths stay equal.
- Aromatic bonds get one cylinder. Double and triple bonds get two and three, offset in the plane of the screen the way Jmol draws them; aromatic bonds get one. Splitting an aromatic ring into alternating doubles would mean picking one Kekulé structure out of several, and a different SMILES for the same molecule picks a different one — the double bonds would land on the other three edges.
The Rust API
use omgkit_depict::three::{self, Style3D};

let mut m = omgkit_io::smiles::parse("CC(=O)Oc1ccccc1C(=O)O")?;
let conf = omgkit_conf::pipeline::conformer_for(&mut m)?;

let d = three::depict(&m, &conf.coords, &Style3D::BALL_AND_STICK)?;
assert!(d.is_clean());                       // the viewpoint is determined
let svg = omgkit_depict::svg::to_svg(&d.scene, &omgkit_depict::style::Style::ACS_1996);
Style3D has public fields, so overriding one is a struct update — this is how
the four panels above were forced to a common scale:
to_svg takes a 2D Style because it is one serialiser for both paths. A 3D
scene contains no text primitives, so the only field it could read is never
reached — the two built-in styles produce byte-identical output, and a test
pins that.
For PNG, enable the raster feature and hand the same scene to
raster::to_png; it goes through the SVG, so the geometry is computed once.
depict takes coordinates rather than a Conformer, so a structure read from
a 3D .mol file works the same way. It does not add hydrogens: in a 3D
figure hydrogens are visible objects, and whether to include them is the
caller's decision. conformer_for adds them; a molblock has whatever it has.
To see the four styles for a molecule of your own:
cargo run -p omgkit-depict --release --features raster --example draw3d -- out/ \
    morphine='CN1CC[C@]23[C@@H]4[C@H]1CC5=C2C(=C(C=C5)O)O[C@H]3[C@H](C=C4)O'

# side by side? force one scale
cargo run -p omgkit-depict --release --features raster --example draw3d -- out/ \
    --scale=36 morphine='CN1CC[C@]23[C@@H]4[C@H]1CC5=C2C(=C(C=C5)O)O[C@H]3[C@H](C=C4)O'
Each line of output reports the canvas size, the primitive count and whether the viewpoint came out degenerate, so a regression shows up as a number rather than as a picture nobody looks at.
How this is checked
harness/check_depict3d.py takes the SVG the library actually emits, reads the
circles and lines back out of it, and recomputes what they should have been —
from the coordinates, the rotation matrix, RDKit's van der Waals radii and
Jmol's colour table. It never reads a number the library computed for it.
Over 400 molecules × 4 styles it checks that the rotation is a rotation and agrees with both numpy's and RDKit's principal axes; that the circles are an orthographic projection of the coordinates; that every radius and colour is what the style and the element say; that of two overlapping spheres the nearer one is drawn later; that each half-bond carries its own atom's colour; that multiple-bond cylinders are offset perpendicular to the projected bond; and that renumbering the atoms leaves the SVG byte-identical.
Each of those was calibrated by breaking it: recolouring carbon RasMol grey, moving the ball radius from 23% to 25%, reversing the depth sort, flipping the determinant, colouring both halves of a bond alike, offsetting multiple bonds in the wrong plane, and summing the second moments in storage order instead of by coordinate. All seven turn the gate red.